The chart below shows the number of men and women in further education in
Britain in three periods and whether they were studying full-time or part-time.
Summarise the information by selecting and reporting the main features, and
make comparisons where relevant.
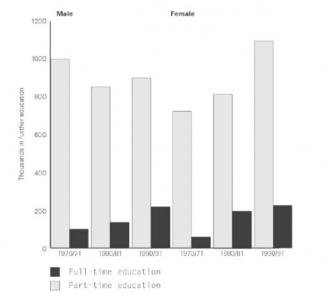
The graph depicts information regarding the total of men and women studying as post-graduates students in Britain. The data collected in three different years and in two types of studying, full-time and part-time.
Post-graduates education is well-known to be taken by students after receiving their bachelor degree. In Britain, the phenomenon of post-graduates study are likely to be done by full-time or part-time. The chart shows a significant popularity of studying part-time and full-time between men and women.
By the data which is shown, we can see the fluctuate numbers of male students in those three years, while female are fairly increasing in both part-time and full-time education. In 1970 until 1990 the numbers of men studying part-time are not stabilized, starting with 1000, then decreased to slightly above 800 in 1980 and increased again in 1990 only slightly below 1000. However the part-time education which is much lower than the part-time education, are fairly increasing by starting with half of 200 until slightly above 200 in 1990.
Different with the female which shows an enhancement of students every year. Starting with slightly under 800 students in 1970 for part-time studying and increased up to nearly 1200 students in 1990. Similar with the part-time education, the full-time education are also upgraded every year. Starting lower than men with only half the numbers of men studying full-time in the same year, and enhance until it reached the same amount of men studying part-time in 1990 with slightly above 200 students.

The data collected in three different years
The data was collected in three different years
However the part-time education which is much lower than the part-time education, are fairly increasing
However the part-time education which is much lower than the part-time education, is fairly increasing
flaws:
Didn't describe the graph clearly.
No. of Words: 249 200
Write the essay in 20 minutes. Don't need to write something out of the graph like:
'Post-graduates education is well-known to be taken by students after receiving their bachelor degree. In Britain, the phenomenon of post-graduates study are likely to be done by full-time or part-time.'
Attribute Value Ideal
Score: 5.0 out of 9
Category: Satisfactory Excellent
No. of Grammatical Errors: 2 2
No. of Spelling Errors: 0 2
No. of Sentences: 12 10
No. of Words: 249 200
No. of Characters: 1287 1000
No. of Different Words: 110 100
Fourth Root of Number of Words: 3.972 4.0
Average Word Length: 5.169 4.6
Word Length SD: 2.756 2.4
No. of Words greater than 5 chars: 87 60
No. of Words greater than 6 chars: 79 50
No. of Words greater than 7 chars: 68 40
No. of Words greater than 8 chars: 43 20
Use of Passive Voice (%): 0 0
Avg. Sentence Length: 20.75 21.0
Sentence Length SD: 8.074 7.5
Use of Discourse Markers (%): 0.417 0.12
Sentence-Text Coherence: 0.471 0.35
Sentence-Para Coherence: 0.647 0.50
Sentence-Sentence Coherence: 0.154 0.07
Number of Paragraphs: 4 4