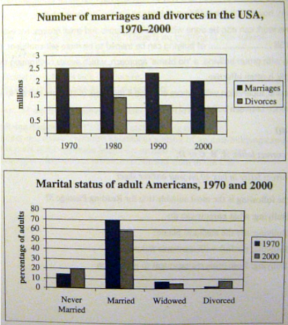
The charts below give information about USA marriage and divorce rates between 1970 and 2000, and the marital status of adult Americans in two of the years.
The bar charts show amount of USA couple who were marriage and divorce since 1970 until 2000, and adult Americans’ marital status at the same time.
The numbers of marriages were generally a decrease, but it was still higher than divorces number every year around that period. In contrast, divorces were steady at one number overall.
In 1970, the number of marriage led with 2.5 million, and it was followed by divorces with 1 million. By 1980, marriage stood in the same number like one decade before, different from marriage, divorce climbed a peak to nearly 1.4 million. The end of the period, marriage fell to 2 million, at the same time divorces were stable at 1 million.
On the other hand, marital status of adult Americans were dominated by married status with 70 percent in 1970 and around 59 percent in 2000. The smallest one was divorced which had nearly 2 percent and 8 percent in 1970 and 2000 respectively.

The bar charts show amount of USA couple who were marriage and divorce
The bar charts show the amount of USA couples who were married and divorced
The numbers of marriages were generally a decrease, but it was still higher than divorces number every year around that period.
Description: can you re-write this sentence?
Attribute Value Ideal
Score: 5.0 out of 9
Category: Satisfactory Excellent
No. of Grammatical Errors: 2 2
No. of Spelling Errors: 0 2
No. of Sentences: 8 10
No. of Words: 161 200
No. of Characters: 738 1000
No. of Different Words: 87 100
Fourth Root of Number of Words: 3.562 4.0
Average Word Length: 4.584 4.6
Word Length SD: 2.261 2.4
No. of Words greater than 5 chars: 59 60
No. of Words greater than 6 chars: 38 50
No. of Words greater than 7 chars: 21 40
No. of Words greater than 8 chars: 7 20
Use of Passive Voice (%): 0 0
Avg. Sentence Length: 20.125 21.0
Sentence Length SD: 4.961 7.5
Use of Discourse Markers (%): 0.375 0.12
Sentence-Text Coherence: 0.466 0.35
Sentence-Para Coherence: 0.653 0.50
Sentence-Sentence Coherence: 0.16 0.07
Number of Paragraphs: 3 4