The charts below give information about USA marriage and divorce rates between 1970 and 2000, and the marital status of adults Americans in two of the years.
Summarize the information by selecting and reporting the main features, make comparisons where relevant.
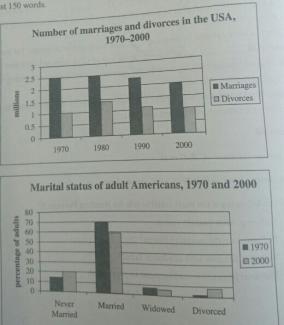
The two diagrams illustrate information about “marriage and divorces in the united states of America between 1970 to 2000” and “marital status of adults Americans in the two years of 1970 and 2000” respectively.
The first figure shows the number of marriages and divorces in USA in a 30-year period from 1970 to 2000. In year 1970 the amount of marriages is about 2.5 million while the divorces amount is about 1 million. After 10 years, the marriage number has no change but the divorce number has a significant increase of about half million. In contrast to the previous decade, in this decade the marriage and divorce number have huge declines of about 200 and 300 thousands respectively. Finally, in the year 2000 the numbers of marriage and divorce have slight falls which make them about two million and one million in respect.
On the other hand, in the other figure the diagrams have information about the marital status of adult Americans in four categories which include “never married”, “married”, “widowed” and “divorced”. The group “married” has the most population in both years. The amount of this group is 70% for 1970 and 60% for 2000. The next rank is for the category of “never married” which has about 20% for year 1970 and 15% for year 2000. The other categories of “widowed” and “divorced” are the least ones. The “widowed” group has less than 10% for both years, while the “divorced” group has about 2% and 9% for years 1970 and 2000 respectively.
To sum up, although figure one shows the amount of divorce in years 1970 and 2000 are the same, the percentages of divorced groups in 1970 and 2000 in the second are shown so differently. Besides, the “married” group has half of million decrease from 1970 to 2000 which is confirmed by the second bar chart.

flaws:
No. of Words: 310 200
Write the essay in 20 minutes. You have a lot of duplicated content. for example, the first paragraph could be removed since you again write in the second paragraph: 'The first figure shows the number of marriages and divorces in USA in a 30-year period from 1970 to 2000.'
Don't need repeat the content like 'adult Americans in four categories which include “never married”, “married”, “widowed” and “divorced”.'
Attribute Value Ideal
Score: 6.0 out of 9
Category: Good Excellent
No. of Grammatical Errors: 0 2
No. of Spelling Errors: 0 2
No. of Sentences: 14 10
No. of Words: 310 200
No. of Characters: 1411 1000
No. of Different Words: 119 100
Fourth Root of Number of Words: 4.196 4.0
Average Word Length: 4.552 4.6
Word Length SD: 2.321 2.4
No. of Words greater than 5 chars: 90 60
No. of Words greater than 6 chars: 66 50
No. of Words greater than 7 chars: 38 40
No. of Words greater than 8 chars: 18 20
Use of Passive Voice (%): 0 0
Avg. Sentence Length: 22.143 21.0
Sentence Length SD: 7.366 7.5
Use of Discourse Markers (%): 0.643 0.12
Sentence-Text Coherence: 0.409 0.35
Sentence-Para Coherence: 0.589 0.50
Sentence-Sentence Coherence: 0.155 0.07
Number of Paragraphs: 4 4