The graph and table below give information about water use worldwide and water consumption in two different countries.
Summarise the information by selecting and reporting the main features and make comparisons where relevant.
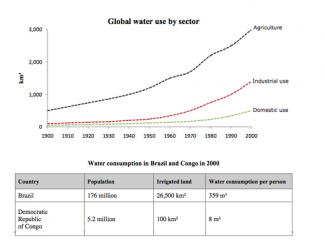
The line graph contrasts on the changes in the use of water around the world by three different sectors, namely, agriculture, industry, and domestic, in terms of a century. The table compares the water consumption differences between Brazil and Democratic Republic of Congo in 2010.
A closer study shows that there was an upward trend happened in all sectors with the agricultural as the highest consumption area. The agricultural rose approximately 600% since it began to steadily increase from 500km³ in 1900 until it reached its peak in the 2000. Both industrial and domestic use were indicated to remain stable in their first 50 years before both jumped to roughly 1000km³ and 250km³ at the end of century.
In general, the table illustrates that Brazil used water for its consumption higher than Congo in 2000. Having a wide area for about ±26500km², Brazil was absolutely to use much water rather than Congo where only had a range of 100km² area.

flaws:
The content didn't cover all information. for example, the table should be addressed like this:
'There was a significant difference between the water consumption in Brazil and Congo in 2000. It was revealed that Brazil had a larger population and irrigated land, as against 5.2 million people and 100km3 respectively in Congo. As a consequence, there was more water used by a Brazilian than by a Congolese, with 359m3 for the former and 8m3 for the latter.'
Read good samples:
http://www.testbig.com/ielts-writing-task-i-essays/graph-and-table-belo…
http://www.testbig.com/ielts-writing-task-i-essays/graph-and-table-belo…
Attribute Value Ideal
Score: 6.0 out of 9
Category: Satisfactory Excellent
No. of Grammatical Errors: 0 2
No. of Spelling Errors: 0 2
No. of Sentences: 7 10
No. of Words: 160 200
No. of Characters: 771 1000
No. of Different Words: 106 100
Fourth Root of Number of Words: 3.557 4.0
Average Word Length: 4.819 4.6
Word Length SD: 2.578 2.4
No. of Words greater than 5 chars: 49 60
No. of Words greater than 6 chars: 34 50
No. of Words greater than 7 chars: 23 40
No. of Words greater than 8 chars: 15 20
Use of Passive Voice (%): 0 0
Avg. Sentence Length: 22.857 21.0
Sentence Length SD: 4.642 7.5
Use of Discourse Markers (%): 0.286 0.12
Sentence-Text Coherence: 0.435 0.35
Sentence-Para Coherence: 0.669 0.50
Sentence-Sentence Coherence: 0.051 0.07
Number of Paragraphs: 3 4