The graph and table below show the average monthly temperatures and average number of hours of sunshine per year in three major cities.
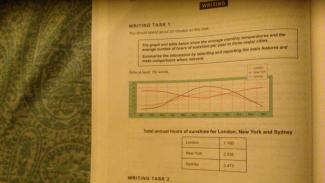
The line graph and the table demonstrate the rate of temperatures per month and the time in hours of sunshine per year in three different cities. Namely, London, New York and Sydney. Overall, it can be seen that, the temperature degrees follow the same trend in London and New York. And London city has the shortest sunshine time per year among the three cities.
According to the graph, the temperature level in London and New York stood at 8 degrees and 4 degrees respectively during January, then it remained the same in the next two months before it roses gradually to peak in July at 30 degre...
Subscribe as testbig VIP readers and get unlimited access to essays on the top list.

Turning to the table, which is clearly illustrate that,
Turning to the table, which clearly illustrates that,
Attribute Value Ideal
Score: 7.5 out of 9
Category: Very Good Excellent
No. of Grammatical Errors: 1 2
No. of Spelling Errors: 0 2
No. of Sentences: 10 10
No. of Words: 248 200
No. of Characters: 1089 1000
No. of Different Words: 106 100
Fourth Root of Number of Words: 3.968 4.0
Average Word Length: 4.391 4.6
Word Length SD: 2.331 2.4
No. of Words greater than 5 chars: 68 60
No. of Words greater than 6 chars: 37 50
No. of Words greater than 7 chars: 26 40
No. of Words greater than 8 chars: 14 20
Use of Passive Voice (%): 0 0
Avg. Sentence Length: 24.8 21.0
Sentence Length SD: 12.432 7.5
Use of Discourse Markers (%): 0.3 0.12
Sentence-Text Coherence: 0.47 0.35
Sentence-Para Coherence: 0.638 0.50
Sentence-Sentence Coherence: 0.156 0.07
Number of Paragraphs: 3 4