The graph below shows the consumption of fish and some different kinds of meat in a European country between 1979 and 2004.
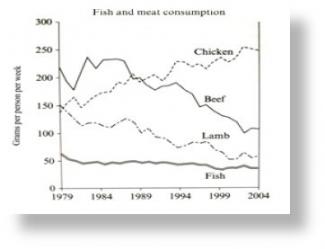

The line graph compares the consumption of fish and three different types of meat, in particular, Chicken, Beef, and Lamb in 1979 until 2004 in a European State.
It is clear that the total amount of eaten Fish and Meat by Europeans showed some fluctuation trends between 1979 and 2004. The most dramatic decreased was seen in the figures of beef, whereas Chicken observed an upward trend during the period.
In 1979, around 220 grams of consumption came from the Beef as the highest amount when the Lamb was being consumed for about 150 grams and followed closely by Chicken at approximately 149 grams per week. The least amounts showed by Fish at just slightly over 50 grams per week and remained leveled off until the end of period. However, the consumption of Beef plummeted enormously over the entire period, after revealed a variation amounts between 1984 and 1989 - dropped to only 100 grams in 2000, after which came after a similar-downward trend by Lamb which was declined progressively with nearly 50 grams per week. Otherwise, the figures of Chicken has a steadily increased and reached a peak of 250 grams by the last year in the question.
To sum it up, revealed from the given data, the majority of European citizens tend to consume chicken rather than Beef, Lamb and Fish.

in 1979 until 2004
from 1979 to 2004
The most dramatic decreased was seen
The most dramatic decrease was seen
whereas Chicken observed an upward trend during the period.
whereas Chicken was observed in an upward trend during the period.
the figures of Chicken has a steadily increased
the figures of Chicken have steadily increased
flaws:
No. of Grammatical Errors: 4 2
Attribute Value Ideal
Score: 5.5 out of 9
Category: Satisfactory Excellent
No. of Grammatical Errors: 4 2
No. of Spelling Errors: 0 2
No. of Sentences: 8 10
No. of Words: 222 200
No. of Characters: 1041 1000
No. of Different Words: 128 100
Fourth Root of Number of Words: 3.86 4.0
Average Word Length: 4.689 4.6
Word Length SD: 2.495 2.4
No. of Words greater than 5 chars: 65 60
No. of Words greater than 6 chars: 51 50
No. of Words greater than 7 chars: 32 40
No. of Words greater than 8 chars: 16 20
Use of Passive Voice (%): 0 0
Avg. Sentence Length: 27.75 21.0
Sentence Length SD: 8.318 7.5
Use of Discourse Markers (%): 0.375 0.12
Sentence-Text Coherence: 0.438 0.35
Sentence-Para Coherence: 0.712 0.50
Sentence-Sentence Coherence: 0.087 0.07
Number of Paragraphs: 4 4