The graph below shows the different modes of transport used to travel to and from work in one European city in 1960, 1980 and 2000.
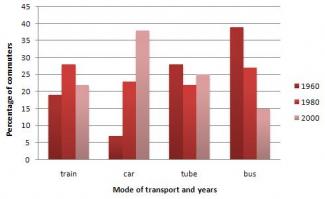
The bar graph compares the percentage of people who used four different means of transportation to travel to and from their workplaces in one city in Europe in the years, 1960, 1980 and 2000.
It is clear that the use of cars for travelling between work and home became the most popular transportation by 2000, while the proportion of bus commuters saw a significant declining trend by the same year. There were fluctuations for train and tube users over the majority of period.
In 1960, buses were the most popular transport with just under 40% of commuters, whereas cars were used by the leas...
Subscribe as testbig VIP readers and get unlimited access to essays on the top list.

Attribute Value Ideal
Score: 7.5 out of 9
Category: Very Good Excellent
No. of Grammatical Errors: 0 2
No. of Spelling Errors: 0 2
No. of Sentences: 8 10
No. of Words: 213 200
No. of Characters: 961 1000
No. of Different Words: 110 100
Fourth Root of Number of Words: 3.82 4.0
Average Word Length: 4.512 4.6
Word Length SD: 2.565 2.4
No. of Words greater than 5 chars: 51 60
No. of Words greater than 6 chars: 37 50
No. of Words greater than 7 chars: 28 40
No. of Words greater than 8 chars: 25 20
Use of Passive Voice (%): 0 0
Avg. Sentence Length: 26.625 21.0
Sentence Length SD: 7.07 7.5
Use of Discourse Markers (%): 0.625 0.12
Sentence-Text Coherence: 0.462 0.35
Sentence-Para Coherence: 0.715 0.50
Sentence-Sentence Coherence: 0.09 0.07
Number of Paragraphs: 4 4