The graph below shows how money was spent on different forms of entertainment over a five-year period.
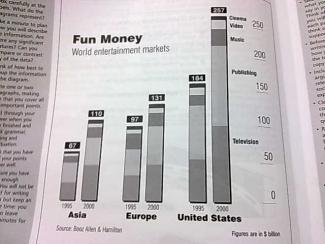
The graph illustrates the amount of money wasted on various patterns of entertainment during five year, beginning fomr 1995 till 2000 in the US? Europe and Asia. According to the data, it can be clearly seen that money spent to different types of entertainment more than Europe and Asia.
Firstly, the total expenditure of entertainment was 67 $ billion in 1995 and it was gradually climbing to 110$ billion in 2000 in Asia.
Compared the information about Europe, it could be made a decision that there was only 34$billion increase and a quantity of money spent on cinema, video and music did not drastically change, whereas the rise of publishing clearly noticed during these five years.
Amount of money used up to entertainment in the US was high in every period, but, while comparing this certain span of years, the level of cinema, video and music stayed with only slight changes, publishing was drastically up and television did not encounter with any changes, consequently, entertainment was utilized 257$ billion totally in 2000.

Comments
Thank you very much!!! it was
Thank you very much!!! it was very useful
Dear, essayE-rater could you
Dear, essayE-rater could you advise what i need to do for getting 7.0? I understood my failures besides these failures what i have to do ? i ll be very happy for your answering
The essay can get more marks
The essay can get more marks if you didn't describe the graph wrongly.
But you still have grammatical issues. Read a good grammar book. You may read this one: http://testbig.com/question/grammar
and you also need to polish sentences. Reading more essays by other top users may help you.
Let us know if you have more questions.
that money spent to different types of entertainment more than Europe and Asia.
that money spent to different types of entertainment in US are more than that in Europe and Asia.
whereas the rise of publishing clearly noticed
whereas the rise of publishing is clearly noticed
Sentence: The graph illustrates the amount of money wasted on various patterns of entertainment during five year, beginning fomr 1995 till 2000 in the US?
Error: fomr Suggestion: from
flaws:
'television did not encounter with any changes' for US?
Attribute Value Ideal
Score: 5.5 out of 9
Category: Satisfactory Excellent
No. of Grammatical Errors: 2 2
No. of Spelling Errors: 1 2
No. of Sentences: 6 10
No. of Words: 172 200
No. of Characters: 841 1000
No. of Different Words: 97 100
Fourth Root of Number of Words: 3.621 4.0
Average Word Length: 4.89 4.6
Word Length SD: 2.784 2.4
No. of Words greater than 5 chars: 55 60
No. of Words greater than 6 chars: 41 50
No. of Words greater than 7 chars: 27 40
No. of Words greater than 8 chars: 20 20
Use of Passive Voice (%): 0 0
Avg. Sentence Length: 28.667 21.0
Sentence Length SD: 17.026 7.5
Use of Discourse Markers (%): 0.5 0.12
Sentence-Text Coherence: 0.491 0.35
Sentence-Para Coherence: 0.818 0.50
Sentence-Sentence Coherence: 0.184 0.07
Number of Paragraphs: 4 4