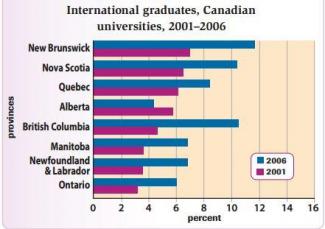
The graph below shows the percentage change in the number of international students graduating from universities in different Canadian provinces between 2001 and 2006.
The graph exhibits how the percentage of graduated international students in different Canadian areas altered between 2001 and 2006, namely New Brunswick, Nova Scottia, Quebec, Alberta, British Columbia, Manitoba, Newfoundland & Labrador and Ontario.
As can be observed from the graph, New Brunswick, Nova Scotia and British Columbia and Quebec placed on top of category (also having over 8% students graduating in 2006). To be more specific, accounting for nearly 7% in 2001, the percentage of students in New Brunswick rose to nearly 12% and got the first place. Nova Scotia and British Columbia stood at the same proportion in 2006 (just over 10%), however, the latter expressed the most significant increase with just over 4% (2.5 times) in 2001 compared with around 6% of the former.
A more detailed look at the graph dísplayed that Manitoba, Newfoundland & Labrador and Ontario shared similar figures and placed on bottom. To be more exact, the percentage of students in Manitoba and Newfoundland & Labrador generated about over 3% in 2001 and doubled to over 6% in 2006. That of Ontario was slightly lower with 3% in 2001 and increased twice to 6% at 2006. Different from others, that proportion in Alberta took at nearly 6% then decreased to just over 4%.
Overall, the number of international students graduating in universities in almost Canadian provinces increased through the period and New Brunchwick took the first place for both years. Meanwhile, Alberta is the only area that declined in figure.

and Quebec placed on top of category
and Quebec are placed on the top of the category
and placed on bottom.
and placed on the bottom.
Attribute Value Ideal
Score: 6.0 out of 9
Category: Satisfactory Excellent
No. of Grammatical Errors: 2 2
No. of Spelling Errors: 0 2
No. of Sentences: 10 10
No. of Words: 244 200
No. of Characters: 1216 1000
No. of Different Words: 121 100
Fourth Root of Number of Words: 3.952 4.0
Average Word Length: 4.984 4.6
Word Length SD: 2.764 2.4
No. of Words greater than 5 chars: 94 60
No. of Words greater than 6 chars: 73 50
No. of Words greater than 7 chars: 55 40
No. of Words greater than 8 chars: 30 20
Use of Passive Voice (%): 0 0
Avg. Sentence Length: 24.4 21.0
Sentence Length SD: 7.877 7.5
Use of Discourse Markers (%): 0.6 0.12
Sentence-Text Coherence: 0.426 0.35
Sentence-Para Coherence: 0.654 0.50
Sentence-Sentence Coherence: 0.098 0.07
Number of Paragraphs: 4 4