The graph below shows the quantities of goods transported in the UK between 1974 and 2002 by four different modes of transport.
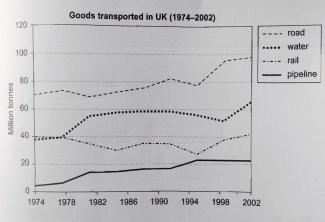
The multi-series line chart provides information on quantities of goods commuted in Britain from 1974 to 2002 by four modes of transports.
Majority of goods was transported with road transportation in the UK during this period. Water and rail transportations were the second and the third most important transportation systems in the UK respectively. Also, transporting goods via pipeline was the least important one.
As shown, road transportation started at 70 million tonnes in 1974 and after fluctuations and slight rise, it peaked at 98 million tonnes in 2002. Water transportation...
Subscribe as testbig VIP readers and get unlimited access to essays on the top list.

Attribute Value Ideal
Score: 7.5 out of 9
Category: Very Good Excellent
No. of Grammatical Errors: 0 2
No. of Spelling Errors: 0 2
No. of Sentences: 8 10
No. of Words: 168 200
No. of Characters: 860 1000
No. of Different Words: 104 100
Fourth Root of Number of Words: 3.6 4.0
Average Word Length: 5.119 4.6
Word Length SD: 3.181 2.4
No. of Words greater than 5 chars: 56 60
No. of Words greater than 6 chars: 42 50
No. of Words greater than 7 chars: 29 40
No. of Words greater than 8 chars: 22 20
Use of Passive Voice (%): 0 0
Avg. Sentence Length: 21 21.0
Sentence Length SD: 6.91 7.5
Use of Discourse Markers (%): 0.5 0.12
Sentence-Text Coherence: 0.447 0.35
Sentence-Para Coherence: 0.748 0.50
Sentence-Sentence Coherence: 0.138 0.07
Number of Paragraphs: 4 4