The graph below shows the quantities of goods transported in the UK between 1974 and 2002 by four different modes of transport.
Summaries the information by selecting and reporting the main features, and make comparisons where relevant.
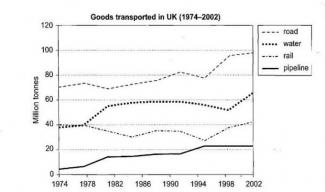
The line graphs illustrate the amount if items delivered by four various types of transportation between 1974 and 2002 in the UK.
Overall, it is immediately evident from the graph that there was a steady increase in the amount of articles sent via road, water and pipeline over a period of eight years. However, most noticeable development was seen in freightage via thoroughfare compared to pipeline which was least popular mode amongst all. An exception of this trend was seen in cargo sent by rail, which saw variable fluctuations over the period and did not have any noticeable increase until the end.
In 1974, roads were mostly preferred over others to carry the consignment and it remained so until 2002, touching the highest point of around 100 million tonnes in 2002. Pipeline was the least preferable method for delivering the items (around 5 million tonnes in 1974) and by the end of the period just over 20 million tonnes of goods were delivered through it.
Transportation per sea and trains, however, had same preference until around 1978, showing figures of around 40 million tonnes. There was a significant change seen in people opting for both these options after this year. Therefore, more people opted to send cargo via sea, while trains became less popular. By the end of 2002, around 65 million tonnes of freight was done by means of water and just over 40 million tonnes by trains.

the amount if items
the amount of items
which was least popular mode
which was the least popular mode
Sentence: However, most noticeable development was seen in freightage via thoroughfare compared to pipeline which was least popular mode amongst all.
Error: freightage Suggestion: No alternate word
Attribute Value Ideal
Score: 7.0 out of 9
Category: Good Excellent
No. of Grammatical Errors: 2 2
No. of Spelling Errors: 1 2
No. of Sentences: 10 10
No. of Words: 239 200
No. of Characters: 1139 1000
No. of Different Words: 135 100
Fourth Root of Number of Words: 3.932 4.0
Average Word Length: 4.766 4.6
Word Length SD: 2.503 2.4
No. of Words greater than 5 chars: 80 60
No. of Words greater than 6 chars: 51 50
No. of Words greater than 7 chars: 30 40
No. of Words greater than 8 chars: 20 20
Use of Passive Voice (%): 0 0
Avg. Sentence Length: 23.9 21.0
Sentence Length SD: 6.395 7.5
Use of Discourse Markers (%): 0.5 0.12
Sentence-Text Coherence: 0.406 0.35
Sentence-Para Coherence: 0.668 0.50
Sentence-Sentence Coherence: 0.101 0.07
Number of Paragraphs: 4 4