The graph shows the proportion of the population aged 65 and over between 1940 and 2040 in three different countries.
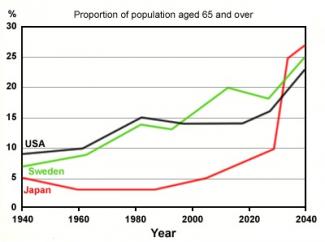
The line graph illustrates the percentage of the people over 65 residing in the different countries like the U.S.A, Sweden, and Japan over a century between 1940 and 2040 indicated in the x-axis. The y-axis shows the proportion from 5% to 30%. The black solid line represents the U.S.A, the green line for Sweden, and the red line for Japan. It is clear that the said Asian country has the most number of senior citizens dominating the other nations for a period of time.
In 1940, the over 65 population for the U.S.A and Sweden was around 9% and 7% respectively while Japan reached 5%. From this time until 1980 for a period of 40 years, the said European country and the U.S.A both have gradual accelerations. On the other hand, the Asian country deliberately declined its numbers until it leveled off during 1980's. Despite the brief rise, the U.S.A reduced its percentage to 14% for almost 20 years then remained unchanged until 2019, then it is incrementally rising to finish just over 20% in 2040.
In sharp contrast to this, Sweden overtook the census of the U.S.A in 2010 reaching to 1/5 of the over 65 population and fluctuating until it reaches to 25% during 2040. Surprisingly the biggest rise was seen in Japan after its gradationally rising census throughout 1980's and 2020's, increasing sharply reaching to 25% and still continues to elevate in 2040 outnumbering the other mentioned countries.
One may safely conclude that over a century, there is an increase in the over 65 population in the 3 different countries.

Comments
Full essay evaluations
Sentence: Surprisingly the biggest rise was seen in Japan after its gradationally rising census throughout 1980's and 2020's, increasing sharply reaching to 25 and still continues to elevate in 2040 outnumbering the other mentioned countries.
Error: gradationally Suggestion: No alternate word
flaws:
No. of Words: 276 200
Write the essay in 20 minutes.
Don't need to paraphrase the line graph like:
'...indicated in the x-axis. The y-axis shows the proportion from 5% to 30%. The black solid line represents the U.S.A, the green line for Sweden, and the red line for Japan.'
Attribute Value Ideal
Score: 7.0 out of 9
Category: Good Excellent
No. of Grammatical Errors: 0 2
No. of Spelling Errors: 0 2
No. of Sentences: 10 10
No. of Words: 276 200
No. of Characters: 1222 1000
No. of Different Words: 136 100
Fourth Root of Number of Words: 4.076 4.0
Average Word Length: 4.428 4.6
Word Length SD: 2.742 2.4
No. of Words greater than 5 chars: 80 60
No. of Words greater than 6 chars: 56 50
No. of Words greater than 7 chars: 39 40
No. of Words greater than 8 chars: 28 20
Use of Passive Voice (%): 0 0
Avg. Sentence Length: 27.6 21.0
Sentence Length SD: 10.8 7.5
Use of Discourse Markers (%): 0.4 0.12
Sentence-Text Coherence: 0.413 0.35
Sentence-Para Coherence: 0.643 0.50
Sentence-Sentence Coherence: 0.066 0.07
Number of Paragraphs: 4 4
Please indicate my mistakes thanks...