The pie charts below show units of electricity production by fuel source Australia and France in 1980 and 2000.
Summarize the information by selecting and reporting the main features, and make comparasions where relevant
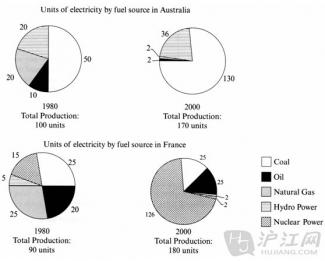

The information below compares the amounts of electricity productions by fuel source in two different countries between 1980 and 2000.
According to the given data, electricity by Coal was obtained the highest amount of production in Australia with initially stood at 50 units in 1980 and increased dramatically at 130 units while Hydro power and natural gas achieved a similar figures with 20 units respectively yet unfortunately there was a significantly declined by Natural Gas with only 2 units, otherwise Hydro power was encountered to rise at 36 units. The least amounts in 1980 showed by Oil at just about 10 units and decreases to 2 units which was similar amount with Natural Gas.
On the other countries, the most striking features was obtained by Nuclear Power which was precisely not used in the previous state - stood with only 15 units in 1980 and achieved a tremendously rose to be highest productivity at 126 units in 2000. Followed by Coal at 20 units which was remained constant from 1980 until 2000, whereas Oil's figures obtained an upward trend with 20 units in 1980 and encountered to rise slightly at 25 units. In contrast to Natural Gas and Hydro power which had a downward trend through the period.
To sum up, there was a diversity of fuel necessary in both countries. Coal was the highest amount in Australia. Otherwise, Nuclear Power was predominantly used in France.

in two different countries between 1980 and 2000.
in two different countries in 1980 and 2000.
electricity by Coal was obtained the highest amount of production in Australia with initially stood at 50 units
Description: can you re-write this sentence?
natural gas achieved a similar figures
natural gas achieved a similar figure
there was a significantly declined by Natural Gas
there was a significantly decline by Natural Gas
The least amounts in 1980 showed by Oil at just about 10 units
The least amounts in 1980 are showed by Oil at just about 10 units
the most striking features was obtained by
the most striking features were obtained by
to be highest productivity
to be the highest productivity
flaws:
No. of Grammatical Errors: 7 2
No. of Words: 235 200
Write the essay in 20 minutes.
------------------------
Attribute Value Ideal
Score: 4.5 out of 9
Category: Satisfactory Excellent
No. of Grammatical Errors: 7 2
No. of Spelling Errors: 0 2
No. of Sentences: 9 10
No. of Words: 235 200
No. of Characters: 1141 1000
No. of Different Words: 117 100
Fourth Root of Number of Words: 3.915 4.0
Average Word Length: 4.855 4.6
Word Length SD: 2.776 2.4
No. of Words greater than 5 chars: 71 60
No. of Words greater than 6 chars: 63 50
No. of Words greater than 7 chars: 45 40
No. of Words greater than 8 chars: 29 20
Use of Passive Voice (%): 0 0
Avg. Sentence Length: 26.111 21.0
Sentence Length SD: 18.835 7.5
Use of Discourse Markers (%): 0.444 0.12
Sentence-Text Coherence: 0.424 0.35
Sentence-Para Coherence: 0.689 0.50
Sentence-Sentence Coherence: 0.11 0.07
Number of Paragraphs: 4 4