The pie charts show the electricity generated in Germany and France from all sources and renewables in the year 2009.
Summarize the information by selecting and reporting the main features and make comparisons where relevant.
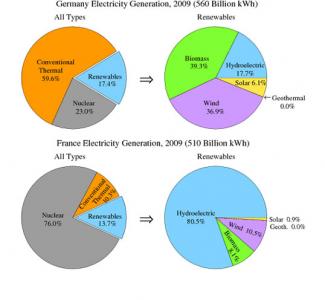
The pie charts compare different methods of generating electricity and 4 types of renewable energy sources in 2 countries in 2009. It can be clearly seen that the amount of electricity generated in Germany was higher than that of France.
To begin with, conventional thermal contributed to 59,6 % of the electricity produced in Germany, which was roughly 2,5 times as high as nuclear figure. Renewables contributed the least to electric power, standing at only 17,4%. In contrast, nuclear power was the main source of electricity in France (76%), while conventional thermal was the least used to pr...
Subscribe as testbig VIP readers and get unlimited access to essays on the top list.

Attribute Value Ideal
Score: 8.0 out of 9
Category: Excellent Excellent
No. of Grammatical Errors: 0 2
No. of Spelling Errors: 0 2
No. of Sentences: 11 10
No. of Words: 215 200
No. of Characters: 1080 1000
No. of Different Words: 112 100
Fourth Root of Number of Words: 3.829 4.0
Average Word Length: 5.023 4.6
Word Length SD: 2.899 2.4
No. of Words greater than 5 chars: 87 60
No. of Words greater than 6 chars: 61 50
No. of Words greater than 7 chars: 40 40
No. of Words greater than 8 chars: 33 20
Use of Passive Voice (%): 0 0
Avg. Sentence Length: 19.545 21.0
Sentence Length SD: 4.831 7.5
Use of Discourse Markers (%): 0.455 0.12
Sentence-Text Coherence: 0.42 0.35
Sentence-Para Coherence: 0.631 0.50
Sentence-Sentence Coherence: 0.102 0.07
Number of Paragraphs: 4 4