The table below gives information about changes in modes of travel in Netherland between 2001 and 2006.
Describe the information in the table and make comparisons where appropriate.
Write at least 150 words.
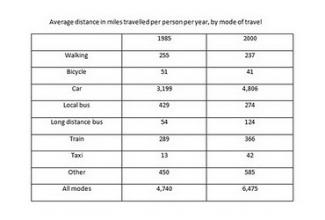
The table illustrates the average distance travelled by English residents per year in 1985 and 2000.
At the first glance, although the number of average distance varied according to mean of transportation and year, car was the most popular mode of travel in recorded years. To specify, starting at 3,199 miles in 1985, the figure of car increased to 4,806 miles in 2000. Walking, local bus, train and other were the less favorite means of transportation. However, while train and other witnessed upward trends with the former increased from 289 mile to 366 mile and the latter increased from 450 ...
Subscribe as testbig VIP readers and get unlimited access to essays on the top list.

Attribute Value Ideal
Score: 7.5 out of 9
Category: Very Good Excellent
No. of Grammatical Errors: 0 2
No. of Spelling Errors: 0 2
No. of Sentences: 7 10
No. of Words: 184 200
No. of Characters: 869 1000
No. of Different Words: 99 100
Fourth Root of Number of Words: 3.683 4.0
Average Word Length: 4.723 4.6
Word Length SD: 2.446 2.4
No. of Words greater than 5 chars: 54 60
No. of Words greater than 6 chars: 41 50
No. of Words greater than 7 chars: 27 40
No. of Words greater than 8 chars: 16 20
Use of Passive Voice (%): 0 0
Avg. Sentence Length: 26.286 21.0
Sentence Length SD: 12.736 7.5
Use of Discourse Markers (%): 0.429 0.12
Sentence-Text Coherence: 0.463 0.35
Sentence-Para Coherence: 0.652 0.50
Sentence-Sentence Coherence: 0.079 0.07
Number of Paragraphs: 3 4