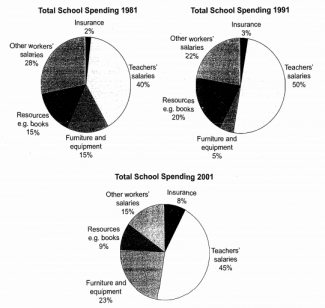
The three pie charts below show the changes in annual spending by a particular UK school in 1981, 1991 and 2001.
Summarize the information by selecting and reporting the main features, and make comparisons where relevant.

The given information compares the differences of total school spending by particularly elected school in United Kingdom between 1981, 1991 and 2001
According to the data described on the pie charts, the highest expenditure in UK school was registered by Teacher Salaries at 40% and rose gradually to 50% in 1991, whereas it achieved slightly decrease in 2001 at 45 %. Followed by the other workers’ salaries at 28% in 1981 which was had the downward trend up to 15 % in 2001. While other subjects faced dramatically fluctuated figures, specifically for furniture and resources which were initially stood at the similar proportion at 15 % in 1981 respectively. After which, there was an interesting trend for both of these factors. Resources outcome owns 20 % of the chart in 1991, whereas in the next 10 years achieved considerable declined with only 9 %. In Contrast, furniture spending was noticeable fall with only 5 % and climbed remarkably to 23 %. The least figures was maintained by Insurance which was remained an upward trend, it was stood at 2 % in 1981 and reached the maximum amount at 8 % in the end of period.
Over all, the biggest expenditure portion in UK school was devoted to teachers’ salaries while other factors remained considerable figures to spend.

in United Kingdom between 1981, 1991 and 2001
in United Kingdom in 1981, 1991 and 2001
whereas it achieved slightly decrease in 2001
whereas it achieved a slight decrease in 2001
which was had the downward trend
which had the downward trend
resources which were initially stood at the similar proportion
resources which initially stood at the similar proportion
Sentence: Resources outcome owns 20 of the chart in 1991, whereas in the next 10 years achieved considerable declined with only 9 .
Description: A noun, plural, common is not usually followed by a noun, singular, common
Suggestion: Refer to Resources and outcome
Description: An adjective is not usually followed by a verb, past tense
Suggestion: Refer to considerable and declined
flaws:
No. of Grammatical Errors: 6 2
Attribute Value Ideal
Score: 5.0 out of 9
Category: Satisfactory Excellent
No. of Grammatical Errors: 6 2
No. of Spelling Errors: 0 2
No. of Sentences: 9 10
No. of Words: 208 200
No. of Characters: 1026 1000
No. of Different Words: 121 100
Fourth Root of Number of Words: 3.798 4.0
Average Word Length: 4.933 4.6
Word Length SD: 2.858 2.4
No. of Words greater than 5 chars: 74 60
No. of Words greater than 6 chars: 65 50
No. of Words greater than 7 chars: 44 40
No. of Words greater than 8 chars: 26 20
Use of Passive Voice (%): 0 0
Avg. Sentence Length: 23.111 21.0
Sentence Length SD: 7.49 7.5
Use of Discourse Markers (%): 0.556 0.12
Sentence-Text Coherence: 0.398 0.35
Sentence-Para Coherence: 0.557 0.50
Sentence-Sentence Coherence: 0.077 0.07
Number of Paragraphs: 3 4