The bar chart shows the different modes of transportation used to travel to work to and from work in one European city , in1950,1970 and 1990.
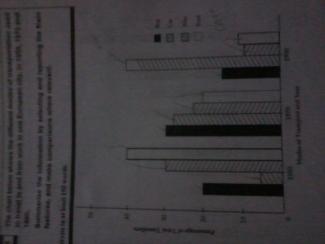
The given bar chart depict about the four modes of transportation used by people to travel to work in one city in the peroid of forty years.
It is quite evident from the chart that ,in 1950,the maximum percentage of travellers were used walk to their work that was 40%.while the least use of transportation was car which was 8 time less by foot transportation. However,the proportion of percentage of travellers in the usage of bus and bike were 20% and 30% respectively.
Moving further,in1970,the modes of transportation used by travellers were continuesly declining from 30% to 20% . Moreover,in the next two decades,the usage of car was at the peak point of 40%.Whereas the proportion of bus,bikeand foot tansportation were nearly same that was 15%,10% and 12% accordingly.
All in all it is concluded that the usage of car transportation was followed an upward trend . whereas ,the bus transport has variable proportion in the given years.

The given bar chart depict about the four modes of transportation
The given bar chart depicts about four modes of transportation
Sentence: The given bar chart depict about the four modes of transportation used by people to travel to work in one city in the peroid of forty years.
Error: peroid Suggestion: period
Sentence: Moving further,in1970,the modes of transportation used by travellers were continuesly declining from 30 to 20 .
Error: continuesly Suggestion: continues
Sentence: Moreover,in the next two decades,the usage of car was at the peak point of 40.Whereas the proportion of bus,bikeand foot tansportation were nearly same that was 15,10 and 12 accordingly.
Error: tansportation Suggestion: transportation
Error: bikeand Suggestion: bike and
flaws:
Always put a space after punctuation marks. Essay e-rater is sensitive.
Attribute Value Ideal
Score: 6.5 out of 9
Category: Good Excellent
No. of Grammatical Errors: 1 2
No. of Spelling Errors: 4 2
No. of Sentences: 6 10
No. of Words: 166 200
No. of Characters: 757 1000
No. of Different Words: 89 100
Fourth Root of Number of Words: 3.589 4.0
Average Word Length: 4.56 4.6
Word Length SD: 2.942 2.4
No. of Words greater than 5 chars: 39 60
No. of Words greater than 6 chars: 31 50
No. of Words greater than 7 chars: 23 40
No. of Words greater than 8 chars: 20 20
Use of Passive Voice (%): 0 0
Avg. Sentence Length: 27.667 21.0
Sentence Length SD: 8.117 7.5
Use of Discourse Markers (%): 0.667 0.12
Sentence-Text Coherence: 0.531 0.35
Sentence-Para Coherence: 0.817 0.50
Sentence-Sentence Coherence: 0.15 0.07
Number of Paragraphs: 4 4