The charts below give information about the diet and general health of two groups of students.
Summarise the information by selecting and reporting the main features and make comparisons where relevant
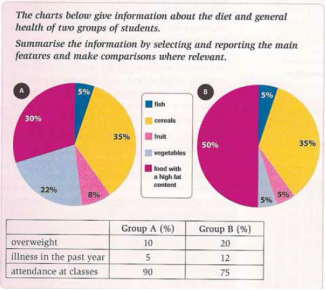
The charts and the graph show a comparison of two different students group in relation to their daily food intake and their health aspects. Overall, there seems to be a direct link between a better life quality and healthier diets. Whereas students in Group A who consume healthier food combinations show better attendance in class, those in Group B show a greater rate of absenteeism.
The two pie charts explain the similarities and differences with regards to the two students’ group diets. In both Group A and B, about a third of the food students eat consists of carbohydrate such as cereal...
Subscribe as testbig VIP readers and get unlimited access to essays on the top list.

Comments
It's really helpful sharing…
It's really helpful sharing. In your spare time, do you enjoy playing sports games? I suggest a fun game called basketball stars to you guys if that's your favorite pastime. You can have fun playing this game either by yourself or with friends. Try to have fun with it.
I appreciate your advice. I…
I appreciate your advice. I'll study it more. penalty kick online
I really like the kinds of…
I really like the kinds of things you write about here dino game. Thank you for giving us some really useful information.
flaws:
No. of Words: 264 200
Attribute Value Ideal
Score: 7.5 out of 9
Category: Very Good Excellent
No. of Grammatical Errors: 0 2
No. of Spelling Errors: 0 2
No. of Sentences: 9 10
No. of Words: 264 200
No. of Characters: 1220 1000
No. of Different Words: 141 100
Fourth Root of Number of Words: 4.031 4.0
Average Word Length: 4.621 4.6
Word Length SD: 2.746 2.4
No. of Words greater than 5 chars: 74 60
No. of Words greater than 6 chars: 57 50
No. of Words greater than 7 chars: 42 40
No. of Words greater than 8 chars: 28 20
Use of Passive Voice (%): 0 0
Avg. Sentence Length: 29.333 21.0
Sentence Length SD: 16.166 7.5
Use of Discourse Markers (%): 0.556 0.12
Sentence-Text Coherence: 0.434 0.35
Sentence-Para Coherence: 0.676 0.50
Sentence-Sentence Coherence: 0.135 0.07
Number of Paragraphs: 4 4