The graph below gives information on wages of Somecountry over 10-year period
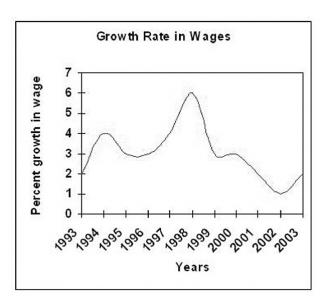
The line graph shows the growth rate of wages in a country between 1993 and 2003. Overall, the figures of wages experienced an upward trend in the first five-year period, and then declined sharply in the following years.
More specifically, the growth rate of income saw a growth trend in 1993, doubling from 2% to 4% in 1994, after which the percentage dropped to 3% in 1995. Subsequently, there was a slow recovery in the figure, which shot up to the peak of 6% in 1998. However, it can clearly be seen that the rate fell quickly afterwards, falling to at the same level as in the year of 1993(3%), before it saw a further drop since 2001. Then, the rate of growth continued to fall and bottomed out at the level of 1% as the graph shown, followed by a gradual rebound in 2003(3%).
In brief, by seeing the graph, the wages grew substantially from 1993 to 1998, while it declined dramatically as the years went by.

Good job!
Attribute Value Ideal
Score: 7.0 out of 9
Category: Good Excellent
No. of Grammatical Errors: 0 2
No. of Spelling Errors: 0 2
No. of Sentences: 7 10
No. of Words: 168 200
No. of Characters: 714 1000
No. of Different Words: 99 100
Fourth Root of Number of Words: 3.6 4.0
Average Word Length: 4.25 4.6
Word Length SD: 2.444 2.4
No. of Words greater than 5 chars: 39 60
No. of Words greater than 6 chars: 29 50
No. of Words greater than 7 chars: 16 40
No. of Words greater than 8 chars: 10 20
Use of Passive Voice (%): 0 0
Avg. Sentence Length: 24 21.0
Sentence Length SD: 5.237 7.5
Use of Discourse Markers (%): 0.571 0.12
Sentence-Text Coherence: 0.447 0.35
Sentence-Para Coherence: 0.66 0.50
Sentence-Sentence Coherence: 0.068 0.07
Number of Paragraphs: 3 4