The graph below shows Long-Term International Migration in UK, 1999-2008.
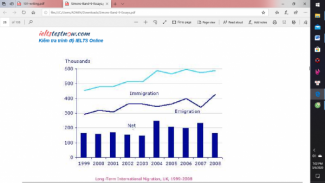
The charts give information about immigration, emigration and net migration between 1999 and 2008.
Overall, there was a fluctuation in the number of immigration and emigration. In terms of net migration, the highest figure was recorded in 2004, while the opposite was true for the number of net migration in 2003.
From 1999 to 2003, the number of net migration ranged from 180 thousand to 150 thousands. However, in 2004, the number of net migration increased remarkably, with its highest figure was approximately 230 thousands. In 2008, the figure reached almost 160 thousands.
Between 1999 and 2003, the number of people who were emigrated increased to 350 thousands. From 2003 to 2004, the figure for immigration increased significantly, while the opposite was true for the figure for emigration, which had a slight decrease. In 2006, the figures for immigration and emigration reached a peak, with 600 thousands and 400 thousands respectively. At the end, the rate of immigration fell to under 600 thousands, while emigration rose to around 420 thousands.
