The graph shows the impact of vaccination on the incidence of whooping cough, a childhood illness, between 1940 and 1990 in Britain. Summarise the information ny selecting and reporting the main features, and make comparison where relevant.
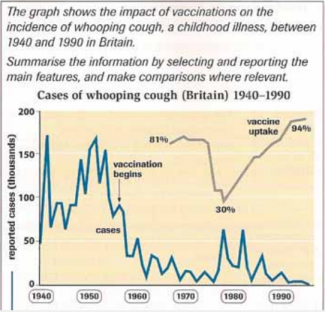
The line graph represents the data of rate of children were vaccinated and the effect of whooping cough, a childhood illness, over the period between 1940 to 1990 in Britain. The general overview here is that there was a fluctuations between the vaccinations and the number of cases reported of whooping cough.
To specify, the graph shows that the number of cases reported has been increased from 50000 in 1940 to 170000 in 1942 before a drop to 60000 in mid 1940s. After that a drastic increment takes place to 170000 again in 1950, the figure decreased to 90000 until the vaccination begins in late 1950s.
On the other hand, number of cases of whooping cough have been reported to around zero in 1960s, while the impact of vaccination growth increased to the percent of 81%. In the late 1970s number of reported cases raised drastically from zero in 1970 to 60000, whereas, the vaccination had a drop to the percent of 30% in 1980. However, the number of incidents dropped from 40000 in mid 1980s to zero in late 1990s, whereas, the vaccination reached a peak with the percent of 94%.
In conclusion, there was a correlation between the vaccinations and the number of reported cases of whooping cough in UK from 1940 to 1990.

The line graph represents the data of rate of children were vaccinated and the effect of whooping cough
The line graph represents the rate of children who were vaccinated and the effect of whooping cough
In the late 1970s number of reported cases raised
In the late 1970s, the number of reported cases raised
flaws:
Sentence Length SD: 3.041 7.5
Attribute Value Ideal
Score: 6.0 out of 9
Category: Good Excellent
No. of Grammatical Errors: 2 2
No. of Spelling Errors: 0 2
No. of Sentences: 8 10
No. of Words: 216 200
No. of Characters: 988 1000
No. of Different Words: 102 100
Fourth Root of Number of Words: 3.834 4.0
Average Word Length: 4.574 4.6
Word Length SD: 2.527 2.4
No. of Words greater than 5 chars: 62 60
No. of Words greater than 6 chars: 45 50
No. of Words greater than 7 chars: 29 40
No. of Words greater than 8 chars: 18 20
Use of Passive Voice (%): 0 0
Avg. Sentence Length: 27 21.0
Sentence Length SD: 3.041 7.5
Use of Discourse Markers (%): 0.5 0.12
Sentence-Text Coherence: 0.507 0.35
Sentence-Para Coherence: 0.766 0.50
Sentence-Sentence Coherence: 0.171 0.07
Number of Paragraphs: 4 4