The table below shows the figures for imprisonment in five countries between 1930 and 1980.
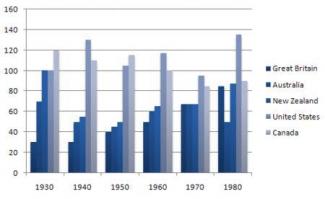
The bar chart compares the number of prisoners in five different countries from 1930 to 1980.
In 1930,Great Britain had the lowest number of prisoners with amongst the countries with 30 thousand. Australia had 70 thousand, New Zealand and USA had the same same number of detainees with 100 thousand; whilst, Canada reached the highest level at almost 120 thousand.
A decade later; Australia, New Zealand and Great Britain had a reduction in the number of prisoners . Although, from 1950 to 1960 the number of prisoners from those three countries actually increased again steadily. Until in 1970, all three had the same number of detainees at 80 thousand respectively.Then in 1980, New Zealand and Great Britain had an increase in their prisoners population. On the contrary, Australia had a sudden drop from 90 to 60 thousand detainees.
As Regards to Canada and USA, Canada prisoners were progressively dropping from 120 to 90 thousand; whereas, the total detainees in the USA each decade changed erraticly. The largest increase of all occurred in 1980, when the number in the USA increased suddenly compared with other countries.
To sum up, amongst the five countries the most significant change in the number of prisoners occurred between Australia and America after 60 years.

Great Britain had the lowest number of prisoners with amongst the countries with 30 thousand
Great Britain had the lowest number of prisoners with 30 thousand amongst the countries
Sentence: As Regards to Canada and USA, Canada prisoners were progressively dropping from 120 to 90 thousand; whereas, the total detainees in the USA each decade changed erraticly.
Error: erraticly Suggestion: erratically
flaws:
Need to polish sentences. Look at this one:
http://testbig.com/ielts-writing-task-ii-essays/table-below-shows-figur…
and this one:
http://testbig.com/ielts-writing-task-ii-essays/table-below-shows-figur…
Attribute Value Ideal
Score: 6.0 out of 9
Category: Satisfactory Excellent
No. of Grammatical Errors: 1 2
No. of Spelling Errors: 1 2
No. of Sentences: 10 10
No. of Words: 210 200
No. of Characters: 1044 1000
No. of Different Words: 98 100
Fourth Root of Number of Words: 3.807 4.0
Average Word Length: 4.971 4.6
Word Length SD: 2.593 2.4
No. of Words greater than 5 chars: 82 60
No. of Words greater than 6 chars: 64 50
No. of Words greater than 7 chars: 48 40
No. of Words greater than 8 chars: 29 20
Use of Passive Voice (%): 0 0
Avg. Sentence Length: 21 21.0
Sentence Length SD: 5.459 7.5
Use of Discourse Markers (%): 0.5 0.12
Sentence-Text Coherence: 0.504 0.35
Sentence-Para Coherence: 0.757 0.50
Sentence-Sentence Coherence: 0.199 0.07
Number of Paragraphs: 5 4