The two pie charts show the average spending by households in a country at two different points in its economic development.
Summarize the information by selecting and reporting the main features, and make comparisons where relevant.
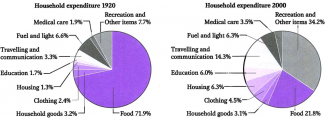
The two pie charts illustrate about household expenditure in a specific country in 1920 and 2000. Overall, whereas food and the group recreation and other items were still the main proportions over the period, there were opposite changing trends between them.
In 1920, food expenditure was the largest percentage which accounted for more than 70% but this number decreased significantly to just over one fifth of the total spending in 2000. Conversely, higher than a third of expenditure in 2000 was recreation and other items, which followed by a considerable rise from 7.7%. As a result, the largest spending belonged to recreation and other items instead of food in 2000.
There were also some noticeable growths over 80 years. While expenditure for clothing was almost double to 4.5%, travelling and communication increased by 11% from just higher than 3%.
In addition, there were some similarities during this period. For example, in both 1920 and 2000, the percentages of household goods and the group fuel and light remained stable around 3.2% and 6.4% respectively.

there were opposite changing trends between them.
Description: 'them' refers to what?
flaws:
Some info lost. like 'Education'
Attribute Value Ideal
Score: 6.5 out of 9
Category: Good Excellent
No. of Grammatical Errors: 1 2
No. of Spelling Errors: 0 2
No. of Sentences: 9 10
No. of Words: 173 200
No. of Characters: 874 1000
No. of Different Words: 103 100
Fourth Root of Number of Words: 3.627 4.0
Average Word Length: 5.052 4.6
Word Length SD: 2.79 2.4
No. of Words greater than 5 chars: 56 60
No. of Words greater than 6 chars: 43 50
No. of Words greater than 7 chars: 34 40
No. of Words greater than 8 chars: 24 20
Use of Passive Voice (%): 0 0
Avg. Sentence Length: 19.222 21.0
Sentence Length SD: 6.795 7.5
Use of Discourse Markers (%): 0.889 0.12
Sentence-Text Coherence: 0.421 0.35
Sentence-Para Coherence: 0.688 0.50
Sentence-Sentence Coherence: 0.087 0.07
Number of Paragraphs: 4 4