The line graph below shows the percentage of tourists to England who visited four different attractions in Brighton.
Summarise the information by selecting and reporting the main features, and make comparisons where relevant.
Write at least 150 words.
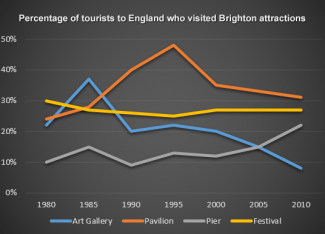
The graph illustrates the changes in the percentage of visitors going to different tourist spots in Brighton from 1980 to 2010.
Overall, the four tourist attractions listed had fluctuations on the numbers of visitors over the years. However, it is prominent from the given graph that the Pavilion reached the highest rate of visitors at some points over the period.
Initially in the 1980s, the Pavilion came only second to the most visited Brighton attraction - which was the Festival. 30% of the visitors went to the Festival while the Pavilion only had about 24% of the people. Third to the most popular in the same year was the Gallery which had 21% - close to the Pavilion's rate. The least visited back then was the Pier which had 10% of the visitors.
Over the years, the Pavilion reached its peak in 1995 - where it had almost 50% of the tourists visiting it. However, it started declining after 1995 - until it fell to only 31%. It is most prominent also in the date that the Festival quite maintained its visitors, to around 28% to 30% over the years. The Art Gallery on the other hand got popular in 1985 where it reached its highest percentage of tourists which was 38% approximately. However, it fell significantly to below 9% towards the end of the period. What's interesting is that the Pier gradually increased its number of visitors by the fact that it was the least visited place before. From just 10% initially, it went up to 21%, almost doubling its rate. This is in fact the only tourist spot that went on an upward trend.

Comments
The graph provides…
The graph provides information about the proportion of the people visiting four different Birghton attractions over the course of 30 years, starting from 1980. Overall there was a downward trend in the percentage of tourists who visited Paviilion and Art Gallery, as opposed to the data for Pier and Festival. In addition, the data for Pavilion recorded the highest number in 1995, meanwhile, the art galleries displayed the greatest difference over the period.
In the first year of the period, the percentage for of tourists who visited Pavillion exceeded the data for Art Gallery by 2% at 21% and 24% respectively. The figure for Pavillion then increased significantly to 48% in 1985, making it the most popular attractions in that year, before a dramatic fall to just over 30% at the end of the period. Likewise, the data for Art Gallery witnessed a rapid growth at 38% from 1980 to 1985, followed by a sharp dip of 30% in the last year of the period.
The proportion of people who visited Pier, accounting for 10% of total tourists in 1980, saw some slight fluctuations between 1985 and 2000, before increasing gradually to 21% in 2010. Meanwhile, 30% of people visited Festival in 1980, which experienced a slow oscillation over a 20-year period, starting from 1980. The data remained unchanged at 28% from 2000 to 2010.
flaws:
No. of Words: 272 200
Write the essay in 20 minutes.
Attribute Value Ideal
Score: 7.0 out of 9
Category: Good Excellent
No. of Grammatical Errors: 0 2
No. of Spelling Errors: 0 2
No. of Sentences: 15 10
No. of Words: 272 200
No. of Characters: 1226 1000
No. of Different Words: 125 100
Fourth Root of Number of Words: 4.061 4.0
Average Word Length: 4.507 4.6
Word Length SD: 2.425 2.4
No. of Words greater than 5 chars: 75 60
No. of Words greater than 6 chars: 62 50
No. of Words greater than 7 chars: 39 40
No. of Words greater than 8 chars: 19 20
Use of Passive Voice (%): 0 0
Avg. Sentence Length: 18.133 21.0
Sentence Length SD: 3.998 7.5
Use of Discourse Markers (%): 0.667 0.12
Sentence-Text Coherence: 0.371 0.35
Sentence-Para Coherence: 0.555 0.50
Sentence-Sentence Coherence: 0.091 0.07
Number of Paragraphs: 4 4