the graph below shows the demand for the electricity in English during typical days in winter and summer. The pie chart shows how electricity is used in an average English home
summarise the information by selecting and reporting the main features, and make comparisons where relevant
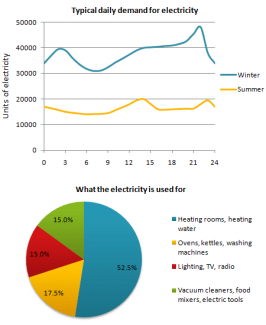
The graph analyzes how many units of electricity are required in England during characteristical days in winter and summer. The pie chart compares the electricity percentages which are utilized in an average English home.
Initially, it is seen that in winter people utilize electricity more than in summer, and it can be explained that in winter, the weather is very cold and people have to use some electric heating machines. Between 12 o'clock and 15 o'clock, in summer the proportion of units is exactly twice less than in winter, whereas the ratio of units peaks. Also, At 21:00, the units reach the peak and decrease gradually and it also can be explained that people are going to sleep.
At a glance, in this pie chart , heating rooms and water section is more than double of the total , and even it is the most enormous one. Machines section (ovens, kettles, and etc ) is 17.5% and while at the same time, domestic appliances section ( such as lighting,TV and etc ) are 15% which means they are the same and used equally

Also, At 21:00, the units reach the peak and decrease gradually
Description: is it for winter or for summer?
Sentence: The graph analyzes how many units of electricity are required in England during characteristical days in winter and summer.
Error: characteristical Suggestion: No alternate word
flaws:
More details wanted from the graph.
Some good samples:
http://www.testbig.com/ielts-writing-task-i-essays/graph-below-shows-de…
http://www.testbig.com/ielts-essays/graph-below-shows-demand-electricit…
http://www.testbig.com/ielts-writing-task-i-essays/graph-below-shows-de…
Attribute Value Ideal
Score: 6.5 out of 9
Category: Good Excellent
No. of Grammatical Errors: 1 2
No. of Spelling Errors: 1 2
No. of Sentences: 7 10
No. of Words: 182 200
No. of Characters: 815 1000
No. of Different Words: 105 100
Fourth Root of Number of Words: 3.673 4.0
Average Word Length: 4.478 4.6
Word Length SD: 2.429 2.4
No. of Words greater than 5 chars: 50 60
No. of Words greater than 6 chars: 37 50
No. of Words greater than 7 chars: 22 40
No. of Words greater than 8 chars: 11 20
Use of Passive Voice (%): 0 0
Avg. Sentence Length: 26 21.0
Sentence Length SD: 6.969 7.5
Use of Discourse Markers (%): 0.429 0.12
Sentence-Text Coherence: 0.431 0.35
Sentence-Para Coherence: 0.688 0.50
Sentence-Sentence Coherence: 0.059 0.07
Number of Paragraphs: 3 4