The bar charts and line graph show the results of a survey conducted over a three-year period to discover what people who live in London think of the city.
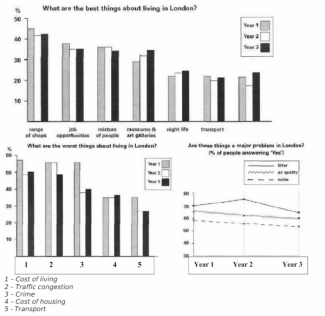
The bar charts and line graph give information about the advantages and disadvantages of living in London according to the responses from residents over a period of three years.
According to the data given by the bar charts and line graph, it can be clearly seen that there is a fluctuating downward trend overall which is likely to be more prominent on the worst things than best things and major problems.
Having an analysis by the level of percentage, the range of shops, job opportunities and the mixture of people have remained on the top of positive aspects, in opposition to cost of livi...
Subscribe as testbig VIP readers and get unlimited access to essays on the top list.

flaws:
No. of Words: 253 200
Write the essay in 20 minutes.
Attribute Value Ideal
Score: 7.0 out of 9
Category: Good Excellent
No. of Grammatical Errors: 0 2
No. of Spelling Errors: 0 2
No. of Sentences: 10 10
No. of Words: 253 200
No. of Characters: 1163 1000
No. of Different Words: 134 100
Fourth Root of Number of Words: 3.988 4.0
Average Word Length: 4.597 4.6
Word Length SD: 2.629 2.4
No. of Words greater than 5 chars: 80 60
No. of Words greater than 6 chars: 54 50
No. of Words greater than 7 chars: 39 40
No. of Words greater than 8 chars: 27 20
Use of Passive Voice (%): 0 0
Avg. Sentence Length: 25.3 21.0
Sentence Length SD: 8.001 7.5
Use of Discourse Markers (%): 0.2 0.12
Sentence-Text Coherence: 0.39 0.35
Sentence-Para Coherence: 0.547 0.50
Sentence-Sentence Coherence: 0.103 0.07
Number of Paragraphs: 3 4