The line graphs shows thefts per thousand vehicles in four European countries between 1990 and 1999.Summarize the information by selecting and reporting the main features and make comparisons where relevant
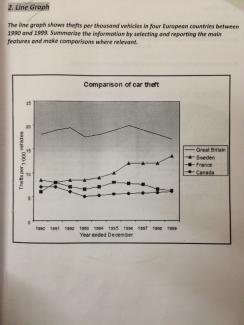
The line graph illustrates the theft per thousand vehicles on the y-axis whereas x-axis depicts the years from 1990 to 1999.
Overall,it is immediately apparent from the graph that there was fluctuation in three countries indicated by three distinct lines as shown in the legends. However,a gradual increase can be noticed for Canada after 1990.
To begin,for the first three years,the maximum thefts were accounted in Great Britain as described by a solid line at about 18 in 1990 to 20 in 1992 whereas rest of the three countries followed a fairly similar pattern lies between 5 to 10 thefts per thousand vehicles. After 1993,there was a modest increase up to 1995 for Great Britain and fall in the following years up to 18 in year between 1996 to 1999.
Interestingly, there was a stabilization in the thefts at Sweden from the year 1996 to 1998 and remained at 13 after that there was a climb till 1999. In Canada, least theft has been noticed,after 1993 there was a gradual increase up to 1999. France represents the most unstable pattern.

Attribute Value Ideal
Score: 7.0 out of 9
Category: Good Excellent
No. of Grammatical Errors: 0 2
No. of Spelling Errors: 0 2
No. of Sentences: 8 10
No. of Words: 186 200
No. of Characters: 846 1000
No. of Different Words: 100 100
Fourth Root of Number of Words: 3.693 4.0
Average Word Length: 4.548 4.6
Word Length SD: 2.452 2.4
No. of Words greater than 5 chars: 53 60
No. of Words greater than 6 chars: 42 50
No. of Words greater than 7 chars: 24 40
No. of Words greater than 8 chars: 12 20
Use of Passive Voice (%): 0 0
Avg. Sentence Length: 23.25 21.0
Sentence Length SD: 12.527 7.5
Use of Discourse Markers (%): 0.375 0.12
Sentence-Text Coherence: 0.434 0.35
Sentence-Para Coherence: 0.704 0.50
Sentence-Sentence Coherence: 0.091 0.07
Number of Paragraphs: 4 4