The second chart shows their destinations over the same period. The first chart below shows the results of a survey which sampled a cross-section of 100,000 people asking if they traveled abroad and why they traveled for the period 1994-98.
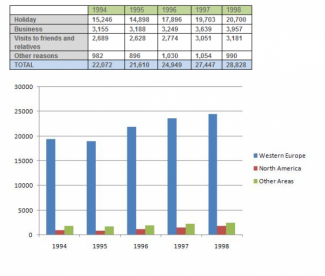
The table compares the data of a research on the reasons for travel, which surveyed by 100,000 people in UK for the period between 1994 and 1998. The bar graphs compare the destination of those 100,000 British people for those periods. As a whole, a majority of the UK citizens travelled to Western Europe and this was their most favourable destination for holiday and business purposes.
Figures of holiday and visits to friends and relative reasons show very similar fluctuation tendency as in the year of 1995, where they drop to 14898 and 2628, respectively. Then this number increases more than it’s originate numbers in 1994 (to 17,896 and 2774 respectively) to reach at 20700 and 3181 respectively. The number of visitors with business and other reasons has a tendency of similar trend of increase from 3155 to 3957 and 982 to 990, respectively throughout the periods.
These people gradually showed their interest with oversea travelling but Western Europe was the best option throughout the years. Western Europe was getting 20,000 people from UK in 1994, while other two countries were collected less than 1,000 tourists. After a small drop in 1995, the population of Western Europe visitors remarkably increased and reached its peak at almost 25,000 in 1998, which was far more significant than any other countries.

Comments
Full essay evaluations
for travel, which surveyed by 100,000 people
for travel, surveyed by 100,000 people
for travel, which was surveyed by 100,000 people
flaws:
You didn't categorize them properly in the second paragraph. Better to categorize them by amount.
holiday: the biggest amount
visits to friends and relative reasons + business: same amount
Other reasons: less amount
-------------------
Total trend: upward
Attribute Value Ideal
Score: 5.5 out of 9
Category: Satisfactory Excellent
No. of Grammatical Errors: 1 2
No. of Spelling Errors: 0 2
No. of Sentences: 9 10
No. of Words: 218 200
No. of Characters: 1088 1000
No. of Different Words: 124 100
Fourth Root of Number of Words: 3.843 4.0
Average Word Length: 4.991 4.6
Word Length SD: 2.568 2.4
No. of Words greater than 5 chars: 82 60
No. of Words greater than 6 chars: 62 50
No. of Words greater than 7 chars: 38 40
No. of Words greater than 8 chars: 22 20
Use of Passive Voice (%): 0 0
Avg. Sentence Length: 24.222 21.0
Sentence Length SD: 5.432 7.5
Use of Discourse Markers (%): 0.333 0.12
Sentence-Text Coherence: 0.395 0.35
Sentence-Para Coherence: 0.62 0.50
Sentence-Sentence Coherence: 0.091 0.07
Number of Paragraphs: 3 4
for travel, which surveyed by 100,000 people
for travel, surveyed by 100,000 people
for travel, which was surveyed by 100,000 people
flaws:
The content doesn't match the images. Can you re-edit the images?
Attribute Value Ideal
Score: ? out of 9
Category: ? Excellent
No. of Grammatical Errors: 1 2
No. of Spelling Errors: 0 2
No. of Sentences: 9 10
No. of Words: 218 200
No. of Characters: 1088 1000
No. of Different Words: 124 100
Fourth Root of Number of Words: 3.843 4.0
Average Word Length: 4.991 4.6
Word Length SD: 2.568 2.4
No. of Words greater than 5 chars: 82 60
No. of Words greater than 6 chars: 62 50
No. of Words greater than 7 chars: 38 40
No. of Words greater than 8 chars: 22 20
Use of Passive Voice (%): 0 0
Avg. Sentence Length: 24.222 21.0
Sentence Length SD: 5.432 7.5
Use of Discourse Markers (%): 0.333 0.12
Sentence-Text Coherence: 0.395 0.35
Sentence-Para Coherence: 0.62 0.50
Sentence-Sentence Coherence: 0.091 0.07
Number of Paragraphs: 3 4