I'm a new member, this is my first post on this website as well as this group. Thanks for your intention.
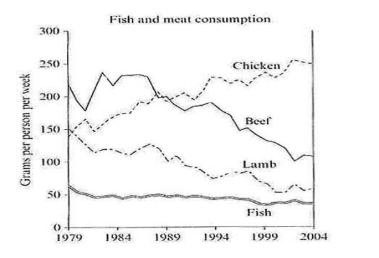
The graph below shows the consumption of fish and some different kinds of meat in a European country between 1979 and 2004.
This line graph gives the figure for fish, meat, lamb and beef that a European country consumed from 1979 to 2004.
Overall, it's evident that the fish and meat consumption fluctuated continually between 1979 and 2004. The fish consumption always was the lowest while the meat one was very complicated.
The lamb figure didn't fluctuate as well as the beef one. The beef consumption always was higher than that of lamb. In 1979, the lamp started around 150 and decrease gradually to 50 grams in 2004. In terms of the beef consumption, there was a rapid dip in 1982 from above 200 to below 200 grams, although after that having a slight growth, the decline still took place continually and the figure in 2004 was approximately 150 grams per person per week.
Only the chicken consumption increased in this period. Although it started at a lower level than a lamb, it reached the highest figure is 250 grams. By contrast, the fish one always stayed at the lowest at around 50 grams, but the good point of fish consumption that it was very consistent, there wasn't any variation in the whole time referred.
178 words -
Thank you!!
Thank you!!
I think you post to a wrong place. Here you go:
https://www.testbig.com/node/add/essay
and you can get a free grade.