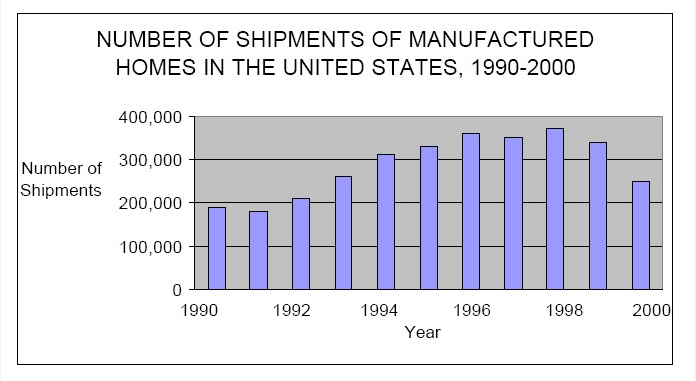
According to the chart shown, which of the following is closest to the median annual number of shipments of manufactured homes in the United States for the years from 1990 to2000,inclusive? Select one of the following answer choices A 250,000 B 280,000 C 310,000 D 325,000 E 340,000 Submit Log in or register to post comments