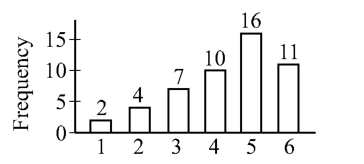
The graph above shows the frequency distribution of 50 integer values varying from 1 to 6. Quantity A The average (arithmetic mean) of the 50 values Quantity B The median of the 50 values Select one of the following answer choices A Quantity A is greater. B Quantity B is greater. C The two quantities are equal. D The relationship cannot be determined from the information given. Submit Log in or register to post comments