The diagram gives information about the process of making carbonated drinks.
https://howtodoielts.com/wp-content/uploads/2020/09/118711718_147270213…
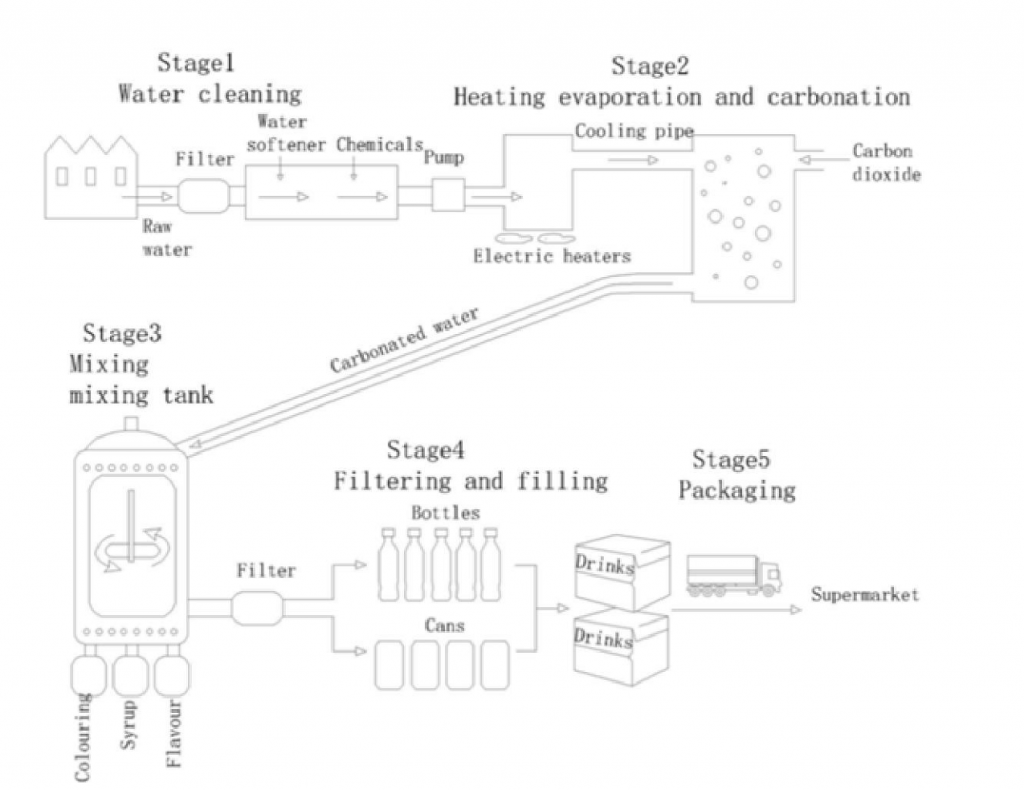
The picture illustrates the production of carbonated drinks. Looking from an overall perspective, it is clear that this man-made process comprises 5 stages, commencing with water being cleaned and ending with the transport of packages to supermarkets.
At the first stage of the process, raw water was being pumped from a big tank to a filter, where it is softened and then treated with chemicals, after which passing through this machine, pump water is cleaned into the electric heaters to evaporation before being cooled in a cooling pipe. Then, carbon dioxide is added to become carbonated water.
The process continues with stage 3 where the carbonated drinks are pushed into a big tank to mix with coloring, syrup, and flavor prior being filtered and filled into bottles as well as cans at the next step. Finally, carbonated water products packed into the boxes are delivered to the supermarket for retail.
| Post date | Users | Rates | Link to Content |
|---|---|---|---|
| Sat, 10/08/2022 - 14:10 | jadenguyen | view |

- The chart below shows numbers of incidents and injuries per 100 million passenger miles travelled PMT by transportation type in 2002 84
- The graph below shows the usage of oil in four different countries between 1966 and 2006 as a percentage of total energy use within each nation 82
- The diagram shows how rainwater is collected for the use of drinking water in an Australian town 89
- M t s ng i ngh r ng s c kh e t t l r t quan tr ng i v i m i ng i v v y d ch v y t kh ng n n c i u h nh b i c c c ng ty v l i nhu n u i m c a d ch v y t t nh n c v t tr i h n nh c i m kh ng 11
- Some people believe that the aging population is good for business the economy and society Other howeve disagree with this view Discuss both views and give your opinion 61